
Learn how Excel dashboards help small and medium businesses control finances, reduce costs, and make better decisions.
Financial control is one of the most critical factors for the survival and growth of small and medium businesses. Many companies generate revenue but still struggle financially due to weak monitoring of expenses, cash flow problems, and lack of clear financial visibility. This is where Excel financial dashboards become a powerful solution.
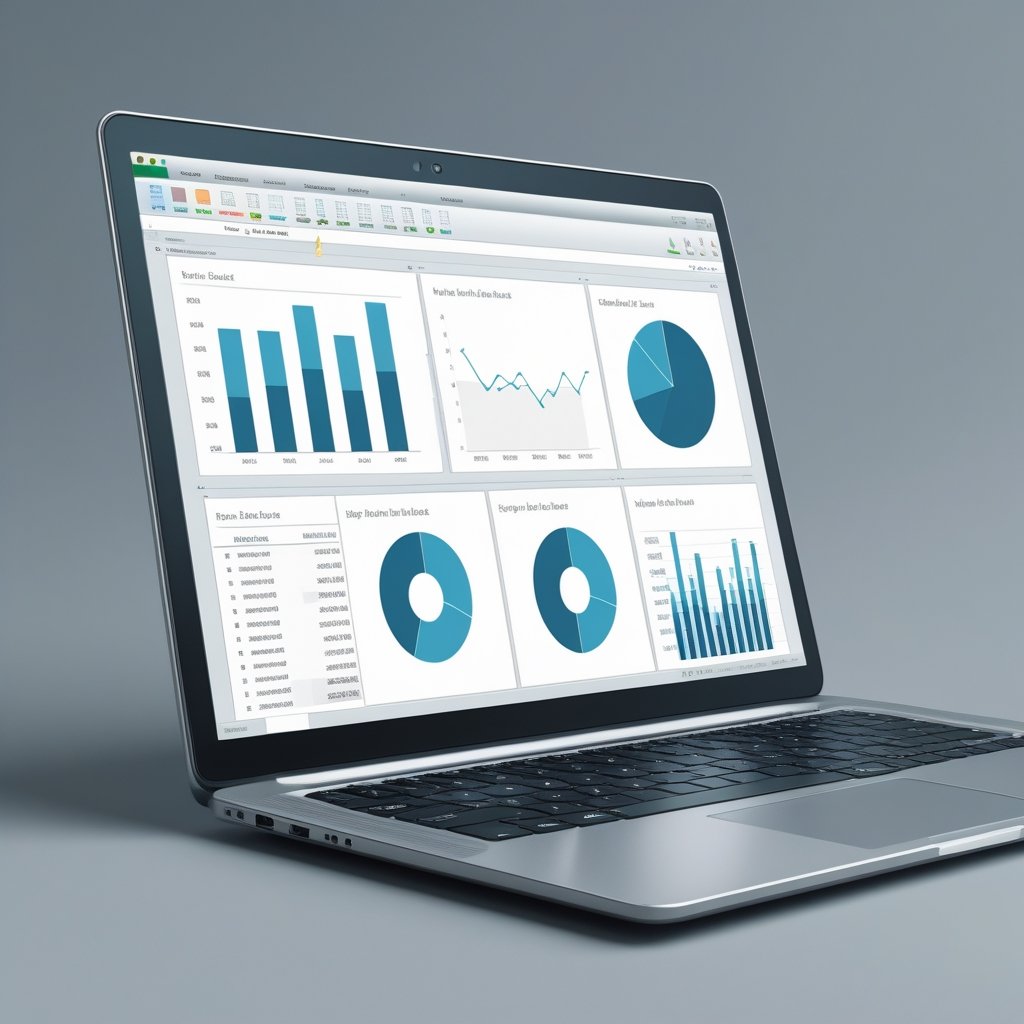
An Excel financial dashboard is a visual summary of key financial data presented through charts, tables, and indicators. Instead of reviewing long accounting reports or raw spreadsheets, business owners and managers can quickly understand the financial health of their company in one screen.
One of the biggest advantages of Excel dashboards is affordability. Unlike expensive accounting software, Excel is already widely used by businesses across Mozambique and other developing economies. This makes dashboards accessible even to small enterprises with limited budgets.
Excel dashboards help businesses track essential financial elements such as income, operational expenses, cash flow, profit margins, and budget performance. By organizing this data visually, managers can identify trends, spot problems early, and take corrective actions before issues escalate.
For example, a dashboard can reveal rising operational costs over several months. Without a dashboard, this increase might go unnoticed until it causes serious cash flow problems. With visual indicators, managers can immediately investigate the cause and implement cost-reduction strategies.
Another key benefit is improved decision-making. When financial data is clear and updated regularly, managers can make informed decisions about pricing, investments, staffing, and expansion. Excel dashboards reduce guesswork and reliance on intuition, replacing them with data-driven strategies.
In small and medium businesses, financial control often depends on the owner or a small management team. Excel dashboards simplify complex financial information, allowing non-financial professionals to understand numbers and act confidently.
In the Mozambican business environment, where companies face currency fluctuations, rising costs, and limited access to credit, Excel dashboards provide stability and control. They help businesses plan better, manage risks, and improve long-term sustainability.
Excel dashboards also support transparency within the organization. When financial information is clearly presented, it becomes easier to communicate performance to partners, investors, and stakeholders. This builds trust and improves accountability.
Practical Use Case
A small retail business can use an Excel dashboard to track daily sales, monthly expenses, and net profit. By monitoring these indicators, the owner can adjust pricing, reduce unnecessary costs, and ensure positive cash flow.
Conclusion
Excel financial dashboards transform raw data into meaningful insights. For small and medium businesses, they are essential tools for controlling finances, improving decision-making, and achieving sustainable growth.